You shouldn’t need a spreadsheet, a magnifying glass, and a prayer just to figure out who finished a course.
I’ve led training programs across teams, audited reporting dashboards that made no sense, and spent way too many hours cleaning data just to get one clear answer. If you’ve been there too, you know how frustrating LMS reporting can be.
But it doesn’t have to be that way. When done right, reporting can give you clarity, not chaos. It can show you what’s working, what’s broken, and where your learners actually need support.
In this guide, I’ll break down the 9 LMS reports that matter most, what smart teams track, and the features I’ve seen real users rely on to save time, fix content gaps, and finally get reporting that drives real results.
What Is LMS Reporting and Analytics?
It’s one thing to deliver training, but knowing if it’s actually working is where reporting comes in.
A solid learning management system gives you more than just surface-level data. With LMS reporting and analytics, you can track who completed what, how they scored, how long they spent on a lesson, and whether they were really engaged.
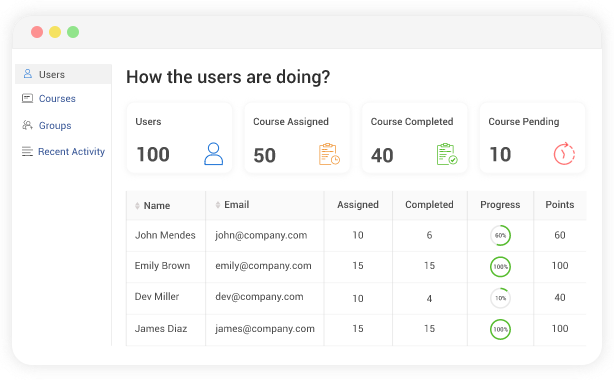
It’s not just about numbers. It’s about spotting patterns, fixing gaps, and making smarter decisions, so your training actually helps people learn and grow.
Whether you’re in HR, L&D, or managing training across teams, LMS reporting and analytics give you the clarity to measure progress, improve content, and better support your learners.
Watch: How to Analyse Training Reports and Stats
9 LMS Reports to Track Training Success
Based on my experience and the real needs of L&D teams, HR, managers, and instructors, these are the 9 LMS reports that actually help. They go beyond just “tracking data” and give you real insights to improve learning, fix issues early, and support your people better.
Let’s walk through each one.
1. Learner Progress Reports – Best for Tracking Individual Learning Journeys
Learner progress reports show you how far someone has gone in their training. These reports track what a learner has started, how much they’ve finished, and how they’re performing along the way. You’re not just seeing who completed the course, you’re seeing how they’re getting there.
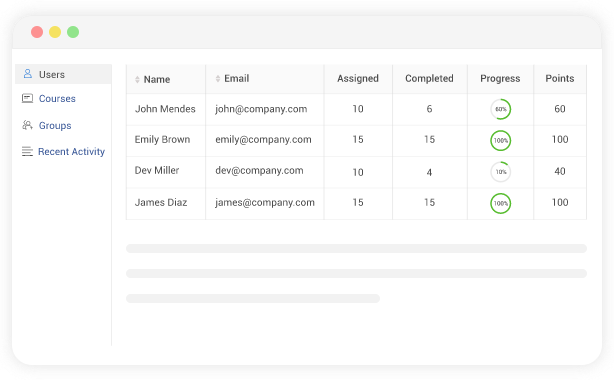
This Type of Report Helps You Answer Questions Like:
- Are learners moving through the content steadily?
- Are they stuck on a specific module?
- Are they skipping important parts?
- How much time are they spending on lessons?
Progress reports give you a detailed look at the learner’s journey. If someone is falling behind or rushing through without understanding the content, the report helps you catch it early.
Key Metrics Tracked:
- Course or module completion percentage
- In-progress status
- Time spent per lesson or activity
- Quiz attempts and scores
- Lesson views or skipped content
Who Uses It:
- Instructors and Trainers – to support learners as they go, not just at the end
- L&D Managers – to monitor progress across teams or departments
- Learners themselves – to track their own progress and stay motivated
Why It’s Valuable:
- Learner progress reports are useful throughout the training, not just at the finish line. They help you take action early. For example:
- If a learner hasn’t logged in for a few days, you can follow up.
- If someone retakes a quiz multiple times, maybe the content needs clarification.
- If a team is moving faster than expected, you might adjust your deadlines.
These reports also show if people are learning the way you intended. You can check if your course structure works or if learners are jumping around or skipping key lessons.
Unlike completion reports that only tell you what’s done, progress reports tell you what’s happening now. That’s what makes them so powerful. They give you the visibility to step in, improve the learning experience, and help your team succeed while they’re still mid-course, not after it’s too late.
2. Completion Reports – Best for Confirming Who Finished Training
While learner progress reports show how far someone has come, completion reports give you a simple, clear answer: Did they finish the training or not?
These reports focus on the end point. They tell you whether someone has completed the course, when they finished it, and whether it was part of a required program. This is especially important for compliance, onboarding, and mandatory certifications, when “almost done” isn’t good enough.
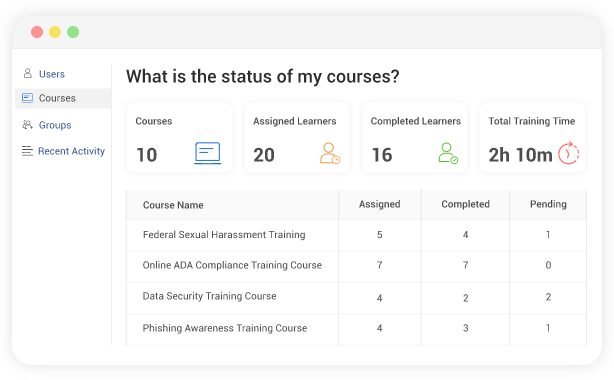
Completion reports are easy to understand, but they carry real weight. If you’re managing a team, responsible for compliance, or preparing for an audit, these reports help you stay accountable and on schedule.
Key Metrics Tracked:
- Completion status (completed / not completed)
- Date of completion
- Time taken to complete
- List of completed vs. pending courses per user
- Required vs. optional training status
Who Uses It:
- HR and Compliance Teams – to track who’s met mandatory training requirements
- Managers and Team Leads – to follow up with employees who haven’t finished
- Course Administrators – to measure course completion across groups
Why It’s Valuable:
Completion reports make it easy to spot who’s done and who hasn’t. That’s critical for roles where training is time-sensitive or required by policy. For example:
- If a new hire hasn’t completed onboarding, the report shows it immediately.
- If a certification course has an expiration date, you’ll see who needs a refresher.
- If only 70% of a department has finished their training, you know where to focus next.
You can also use these reports to celebrate completions. When learners finish, it’s a milestone worth recognizing, and this report gives you the data to do that.
Where progress reports track the journey, completion reports confirm the destination. They’re both important, but for different reasons. You need progress reports to guide learners along the way, and you need completion reports to ensure nothing gets missed in the end.
These reports are especially helpful in regulated industries, safety training, and any program with deadlines. You get clear, actionable data that helps you keep your team on track and covered.
3. Assessment Reports – Best for Measuring Learning and Retention
Completion doesn’t always mean understanding. That’s where assessment reports come in.
These reports tell you how well learners are grasping the material. They pull data from quizzes, tests, assignments, or knowledge checks built into your course. Instead of just seeing that someone finished a lesson, assessment reports show you how much they actually learned.
You can see who’s scoring well, who’s struggling, and where learners might be misunderstanding key topics. This helps you improve both the content and the support you provide.
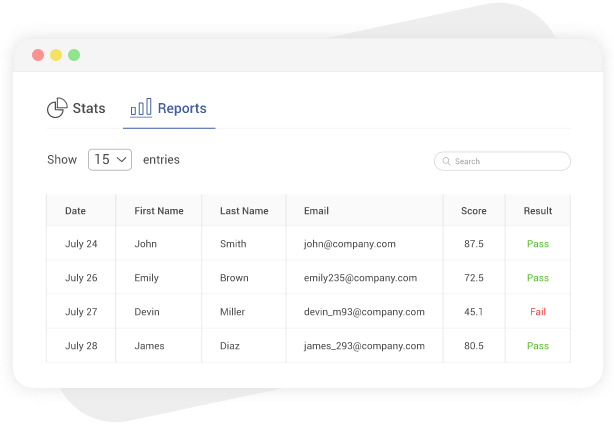
Key Metrics Tracked:
- Quiz/test scores (per user and overall)
- Number of attempts and retakes
- Correct vs. incorrect responses
- Time taken to complete assessments
- Pass/fail status
Who Uses It:
- Instructors and Trainers – to measure the effectiveness of teaching
- L&D Teams – to identify content gaps or common sticking points
- Learners – to understand their own strengths and where to improve
Why It’s Valuable:
Assessment reports help you connect learning to performance. For example:
- If many learners are failing a specific quiz, it could mean the content is unclear.
- If someone retakes the same test multiple times, they might need extra help.
- If a team scores high consistently, that’s a sign the training is working well.
These reports also help you tailor learning paths. If a learner aces an assessment, maybe they can skip ahead. If they’re struggling, you can suggest a review module or offer one-on-one support.
And for high-stakes training, like safety procedures, legal compliance, or product knowledge, you can’t just assume someone “got it.” You need proof they understand the material. Assessment reports give you that proof.
This is why they’re different from progress or completion reports. Progress shows how far learners have gone. Completion shows if they finished. Assessment shows what they actually learned. All three give you a full picture, and this piece is critical for learning effectiveness.
4. Engagement Reports – Best for Understanding Learner Interest and Interaction
Just because someone logs in doesn’t mean they’re paying attention. Engagement reports help you see how learners are interacting with your content, not just if they’re completing it, but how involved they actually are.
These reports go deeper than completion or scores. They show whether learners are staying focused, watching videos, clicking through slides, participating in discussions, or skipping around. This helps you determine whether your content is connecting with them or losing their attention.
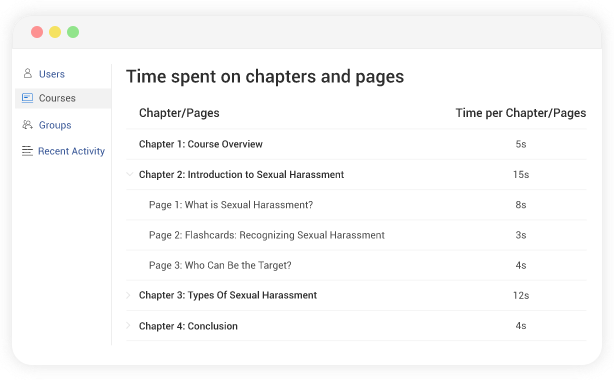
Engagement data helps you answer questions like:
- How much time are learners spending on the courses?
- Are learners watching the full videos or dropping off halfway?
- Are they engaging with practice quizzes or skipping them?
- Are they actively participating in discussions or activities?
Key Metrics Tracked:
- Time spent on each module or page
- Video watch duration and drop-off points
- Click-through and interaction rates
- Number of repeat visits to a lesson
- Participation in forums, polls, or discussions
Who Uses It:
- Course Creators and Instructional Designers – to see if content is working as intended
- L&D Managers – to compare engagement across teams or departments
- Instructors – to spot low-interest areas that may need updating
Why It’s Valuable:
- Engagement reports help you catch problems early. For example:
- If a video has a high drop-off rate, it may be too long or confusing.
- If learners are skipping practice quizzes, they may not see value in them.
- If a module gets frequent revisits, it could be unclear or really useful.
These reports are also helpful for improving course design. You can test different content formats (videos, text, interactive elements) and see what keeps learners engaged.
Progress reports show how far someone got, assessment reports show what they understood, and engagement reports show how interested they were along the way. That’s critical if you want your training to actually stick, not just be checked off a list.
If learners aren’t engaged, the content isn’t going to be effective, no matter how well it’s written. Engagement reports give you the data you need to fix that.
5. Compliance Reports – Best for Tracking Mandatory Training and Certifications
Some training isn’t optional; it’s required by law, policy, or internal standards. That’s where compliance reports come in.
These reports help you track whether learners have completed the full compliance courses and certifications that are mandatory, not just recommended. They’re especially important in industries like healthcare, finance, construction, and any workplace where safety, data protection, or legal regulations are involved.
Compliance reports focus on accountability. They show who has completed the required training, who is overdue, and when certifications will expire. This way, you’re not scrambling at the last minute; you always know where things stand.
Key Metrics Tracked:
- Completion status of required courses
- Certification dates and expiration
- Overdue or upcoming deadlines
- Compliance rates by team, department, or location
- Proof of training for audit or legal purposes
Who Uses It:
- HR and Compliance Officers – to monitor legal or regulatory training
- Managers – to keep their teams compliant
- Training Admins – to schedule recertifications and reminders
Why It’s Valuable:
Compliance reports reduce risk. For example:
- If a safety course isn’t completed on time, you’re exposed to liability.
- If an employee’s certification has expired, it could lead to penalties.
- If you’re audited, you need clear records to show every requirement was met.
These reports also help you stay proactive. Many LMS platforms let you automate reminders for upcoming deadlines or schedule recertification in advance. You don’t have to track this manually; the report handles it.
It’s worth repeating: not all training is equal. Some learning is about growth, some is about compliance. Compliance reports help you prove what must be done and that it’s been done right.
They give you peace of mind that your people, processes, and records are covered, whether you’re preparing for an audit or just running a responsible training program.
Watch: What Is Compliance Training?
6. Group Reports – Best for Comparing Team Performance and Participation
Training doesn’t always happen one person at a time. In many organizations, courses are assigned to entire teams or departments. Group reports help you track how those teams are doing as a whole.
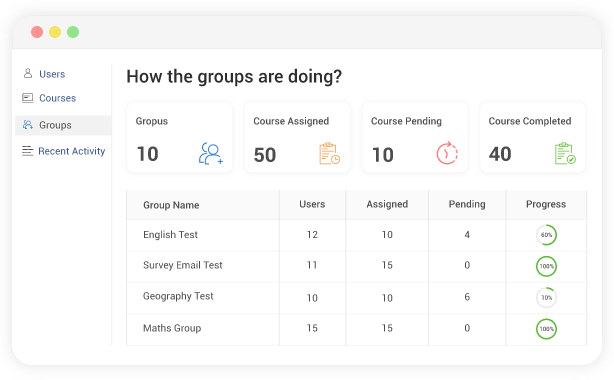
These reports show the performance, progress, and engagement of learners grouped by role, department, location, or any other category your LMS supports. Instead of looking at just individual results, you get a broader view and that makes it easier to see patterns.
You can compare how different teams are progressing, which departments are falling behind, or which locations are completing training on time. It’s a practical way to manage training at scale.
Key Metrics Tracked:
- Completion rates by group
- Average assessment scores across teams
- Time spent on training per team
- Progress distribution within groups
- Group-level engagement or participation trends
Who Uses It:
- L&D Managers – to oversee training across multiple teams
- Team Leads and Department Heads – to monitor their group’s progress
- HR and Operations Teams – to identify training needs across functions
Why It’s Valuable:
Group reports give you big-picture insight. For example:
- If one department has low completion rates, it might mean they need more support or a different schedule.
- If a team consistently scores lower on assessments, you might adjust the content or offer extra coaching.
- If one group is highly engaged, you can study what’s working and apply it elsewhere.
They’re also helpful when launching company-wide training programs. You can track progress by region, business unit, or role, making sure no group is left behind.
Unlike individual progress reports, group reports help you manage training at the team level. They make it easier to plan, compare, and improve learning outcomes across the board.
Training isn’t just personal, it’s also organizational. Group reports help you see how well learning is happening at scale.
Watch: How to Enable Collaboration & Discussions in Your Course
7. Survey Reports – Best for Collecting Feedback and Improving Training
Good training isn’t just about what learners complete; it’s also about how they feel about it. That’s where survey reports come in.
These reports gather and summarize feedback collected through course surveys, post-training questionnaires, or satisfaction forms. They help you understand what’s working, what’s confusing, and what needs to change, directly from the learners themselves.
You’re not guessing how your training was received. You’re using real feedback to make informed decisions.
Key Metrics Tracked:
- Learner satisfaction ratings
- Net Promoter Score (NPS) or similar scoring scales
- Comments and written feedback
- Survey participation rates
- Trends over time or by course
Who Uses It:
- Course Creators and Instructors – to evaluate content quality
- L&D Teams – to track learner sentiment at scale
- HR and Program Managers – to align training with employee needs
Why It’s Valuable:
- Survey reports give you the learner’s perspective. For example:
- If feedback shows that a course feels too long or too fast-paced, you can adjust the pacing.
- If multiple people mention unclear instructions, you know exactly what to fix.
- If learners rate a course highly, you know it’s something worth keeping and expanding.
You can also use survey data to track improvement over time. If a course had low ratings last quarter but better ones now, it shows your changes made a difference.
No other report tells you how people feel about the training. Survey reports fill that gap. They help you improve not just the structure of your training, but the experience, and that leads to better learning outcomes.
When learners feel heard, they’re more engaged. And when you act on their feedback, your training gets stronger with every session.
8. Customizable Reports – Best for Getting Exactly the Insights You Need
Not every organization tracks the same things. That’s why customizable reports matter.
These reports let you build your own view of the data. Instead of relying on default templates, you can choose which metrics to include, apply filters, and tailor the layout to match your goals, whether you’re tracking performance by region, analyzing engagement by job role, or comparing results across time periods.
This flexibility saves time and makes your reporting more relevant.
Key Features (and Metrics You Can Track):
- Filter by date, department, location, role, or course
- Combine multiple metrics (e.g., completion + quiz scores + engagement)
- Export data in formats like CSV or Excel
- Create visual dashboards for internal reviews
- Schedule automated reports to email
Who Uses It:
- Training Administrators – to get specific answers without digging through multiple reports
- L&D Analysts – to align training data with business KPIs
- Managers and Leadership – to request custom views for strategic decisions
Why It’s Valuable:
Customizable reports help you move from generic insights to meaningful analysis. For example:
- If leadership wants to know how new hires in one region are performing, you can filter by cohort, course, and location — all in one report.
- If HR needs a breakdown of overdue compliance training by department, you can create that view instantly.
- If your L&D team is tracking course effectiveness by engagement and performance, you can combine those metrics in a single dashboard.
- It’s not just about having data — it’s about having the right data for your needs. That’s what makes customizable reports different from every other report on this list.
They’re flexible, targeted, and built to answer your exact questions, without making you sift through pages of irrelevant numbers.
9. Leaderboard Reports – Best for Highlighting Top Performers and Driving Motivation
If you want to add a bit of friendly competition to your training, leaderboard reports are a great tool.
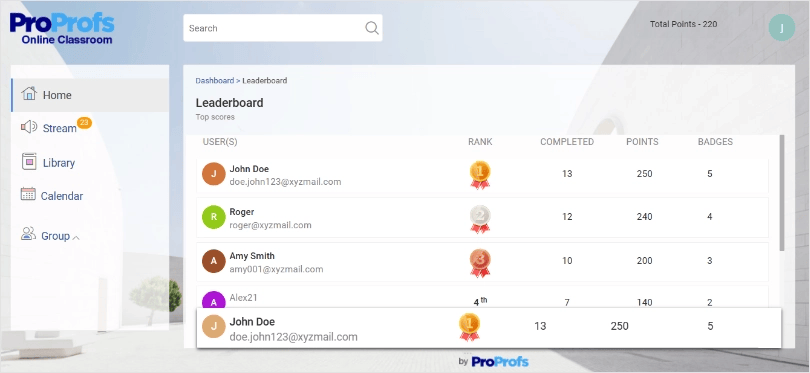
These reports rank learners based on key metrics like course completion, quiz scores, time taken, or earned points. They help you identify top performers and encourage others to stay engaged by showing how they’re doing compared to their peers.
Used wisely, leaderboards can boost motivation, especially in large teams or during company-wide training programs.
Key Metrics Tracked:
- Learner rankings by score, completion time, or points
- Top performers per course or team
- Badge or certificate achievements
- Time to completion comparisons
Who Uses It:
- Learners – to track their own progress and stay motivated
- Instructors and Trainers – to recognize high achievers
- Managers – to encourage participation and highlight team leaders
Why It’s Valuable:
- Leaderboard reports help you celebrate success. For example:
- You can recognize employees who finish early or score consistently high.
- You can spotlight top performers during team meetings or internal newsletters.
- You can use rankings to create reward systems, like badges or incentives.
They’re also useful for spotting patterns. If the same names keep appearing at the top, that might show who’s ready for more advanced training. If certain groups are underperforming, you can follow up to see why.
That said, leaderboards work best when used positively, to encourage and reward, not to shame or pressure. Not every learner wants to compete, but this report gives those who do an extra push.
What makes leaderboard reports unique is their focus on recognition and motivation. They turn learning into something visible, measurable, and in some cases, fun, which can lead to higher engagement across your program.
LMS Reporting Features That Actually Solve User Problems
Most LMS platforms promise “powerful reporting,” but when you log in, you only get a cluttered dashboard and no idea where to click.
Reporting should be simple. You should be able to answer real questions fast, like: Who hasn’t finished training? Is this course actually helping? Which teams are falling behind?
Here are the reporting features that actually help you get there:
1. Ready-to-Use Reports That Don’t Need Setup
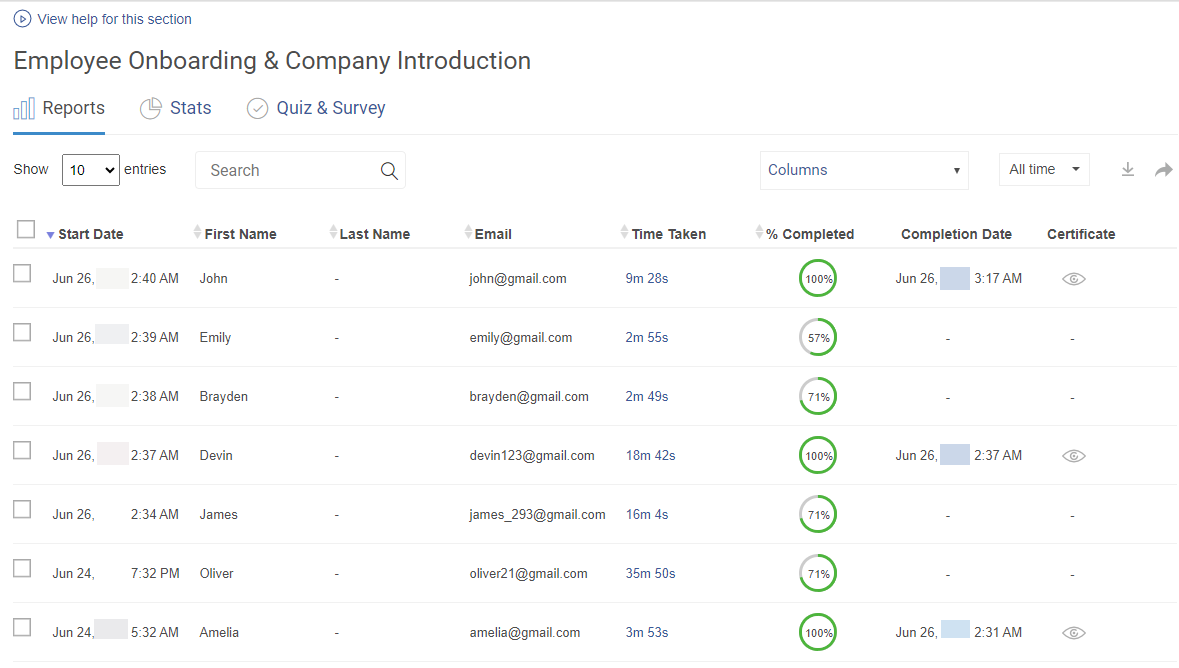
You don’t always have time to build a custom report. Good LMS tools give you default reports for course progress, completion, scores, and more. ProProfs, for example, includes these out of the box, with no setup needed. You open the report, and the numbers are already there.
2. Filters That Let You Focus
Need to see data for just one team or filter by course date? You should be able to apply filters easily, like by user group, job role, or time period, without exporting to Excel every time. This makes it easy to find what matters and ignore the rest.
3. Dashboards You Can Actually Understand
A bunch of rows and columns won’t help unless you can see the story. Visual dashboards, bar graphs, completion rings, and trend lines help you spot what’s working and where things are slipping. No data science degree is needed.
4. Reports That Email Themselves
Instead of checking your LMS every morning, some tools (including ProProfs) let you schedule reports to hit your inbox. You pick the report and how often you want it. That’s one less tab to open and less chasing people for updates.
5. Export Options That Make Sharing Easy
When HR asks for a compliance update or your boss wants a list of top performers, you should be able to export reports instantly. Formats like Excel or CSV give you flexibility to use the data however you need.
Watch: How to Share Quiz or Course Reports With Your Learners
6. Click to Dig Deeper
High-level numbers are helpful, but sometimes you need details. Drill-down features let you click on a metric, like “20 learners incomplete,” and see the exact names, scores, or actions they took.
7. Real-Time Data, Not Yesterday’s News
Static reports age fast. With real-time tracking, you see the latest learner activity as it happens, whether someone just passed a test or missed a deadline. That way, you’re always acting on current info, not chasing old data.
8. Access Control That Makes Sense
Not everyone should see everything. With role-based access, managers can see their team’s reports, admins can see the full system, and learners can see their own progress. This keeps sensitive information in the right hands.
Track Employee Training Progress Hassle-Free
Enhance your LMS with advanced reporting tools.
LMS Reporting Requirements for Effective Training Evaluation
I’ve purposely created this section because there’s a common misconception that LMS reporting features and reporting requirements are the same. While features provide data, requirements define the specific data points crucial for effective training evaluation.
Now, let’s understand the essential reporting requirements that help assess the impact of your training programs:
- Assessment Performance:
- Requirement: Analyze average scores, pass/fail rates, and individual scores.
- How: Use this data to identify knowledge gaps and areas needing improvement in the training content or delivery methods.
- What: Look for trends in specific question performance to see if assessments accurately measure the intended learning objectives.
- Learning Outcomes:
- Requirement: Track completion rates for assessments and knowledge checks.
- How: Use these completion rates to gauge overall comprehension of the training material.
- What: Consider reports on pre- and post-training assessments to measure knowledge gain and effectiveness of the training program.
- Learner Feedback:
- Requirement: Integrate LMS reporting with surveys to capture post-training feedback.
- How: Ask learners about content clarity, delivery methods, and overall effectiveness of the training.
- Why: Analyze open-ended responses for specific areas of improvement.
- Application & Retention:
- Requirement: Track the application of the acquired knowledge on the job (if applicable).
- How: This could involve manager feedback or follow-up assessments after a specific period.
- What: Analyze this data to see if learners are successfully applying the learned skills and knowledge in their work.
Effective LMS reporting goes beyond simply collecting data. The true value lies in interpreting and using the results to improve future training programs.
For example, if learners consistently score low on a certain module, revising the content or adding more resources might help. When feedback points out that a concept is tricky, maybe we could make it clearer by including interactive elements or real-world case studies to help everyone understand better.
By following these requirements, you can ensure that your LMS reporting provides the necessary data points to evaluate your training programs effectively and make data-driven decisions for improvement.
Get Free LMS Software — All Features, Forever.
We've helped 567 companies train 200,000+ employees. Create courses in under a minute with our AI LMS or use 200+ ready-made courses on compliance, harassment, DEI, onboarding, and more!
Why LMS Reporting Is More Than Just Numbers
Good LMS reporting doesn’t just show data, it helps you do something with it. When used well, it becomes a tool for faster decisions, smarter content updates, and stronger team support.
Here’s how it actually makes a difference:
1. It Saves Time You’d Otherwise Waste on Guesswork
Without reporting, you’re stuck chasing updates manually, checking who finished what, following up on late completions, or digging through emails to get status reports. A solid LMS, like ProProfs Training Maker, lets you see everything in one dashboard. You can quickly spot where things stand, download reports if needed, and spend more time acting, not searching.
2. It Helps You Improve Your Training Content
LMS reporting shows you what’s working and what’s not. If most learners drop off halfway through a video or keep failing the same quiz, that’s not just a number; it’s a signal. You can fix content gaps faster, test new formats, and make sure your training actually works for your people.
3. It Gives Leadership Real Insight Into Training ROI
When the leadership team asks how training is helping the business, reporting gives you clear answers. You can show completion rates, skill improvement, and engagement levels, backed by data, not opinions. This helps justify budgets, expand learning programs, and prove impact.
4. It Empowers Managers to Support Their Teams Directly
Instead of waiting for L&D or admin teams to share reports, managers can use LMS dashboards to track their team’s progress themselves. They can follow up with team members who are behind, spot top performers, and adjust timelines as needed without sending emails back and forth.
5. It Boosts Engagement by Showing Learners They’re Supported
When learners know someone’s paying attention, not to judge, but to help, they tend to stay more involved. LMS analytics let you step in when someone is stuck, recognize achievements, or recommend a quick review. It turns training from a checklist into an experience that actually feels supported.
Best Practices to Get More From LMS Reporting
When implementing LMS reporting in a corporate environment, best practices can ensure the process is effective. I have curated a set of practices that might just save you from drowning in data or the boredom of endless spreadsheets! (Trust me, it saved me a lot!).
- Define Clear Objectives: Before you dive into the data, know what you want from it. Are you tracking compliance, engagement, or performance? Each goal requires different metrics, so set your targets early.
- Customize Reports for Different Audiences: Not everyone loves number crunching. Customize your reports to suit the audience. Executives might prefer high-level dashboards, while trainers need detailed reports on learner progress.
- Automate Wherever Possible: Automate mundane tasks to save time and avoid errors. Scheduled reports can automatically update stakeholders on key metrics, keeping everyone in the loop without manual intervention.
- Use Visuals to Simplify Data: A picture is worth a thousand spreadsheets. Use graphs, charts, and heat maps to make data easier to digest. This way, you might keep everyone awake during those monthly report meetings!
- Regularly Review and Revise Reporting Practices: What worked last year might not work this year. Review your reporting practices regularly to ensure they still meet corporate needs and make adjustments as necessary.
- Train Your Team: Ensure everyone uses the LMS reporting tools effectively. A little training can go a long way in improving the accuracy and usefulness of your reports.
- Encourage Feedback: Sometimes, the best improvements come from the users themselves. Encourage feedback on the reports from all levels within the organization. This can lead to valuable insights that no amount of data can show.
- Maintain Data Integrity and Security: Last but not least, ensure your data is accurate and secure. Reliable data builds trust in the reports, and securing this data protects your learners’ privacy.
Implementing these best practices will improve your LMS reporting and add a bit of flair to the usually dreary task of dealing with data. After all, who says you can’t have fun with figures?
LMS Reporting Is Your Training Advantage
Good training isn’t just about delivery. It’s about understanding what’s working, fixing what’s not, and using data to drive smarter decisions.
LMS reporting and analytics give you that edge.
When you stop guessing and start tracking the right insights, progress, engagement, assessments, and more, you save time, improve content, and actually help people learn better.
Tools like ProProfs Training Maker simplify this process with built-in, ready-to-use reports, real-time dashboards, and automated reporting options that cut out manual work and help managers and L&D teams take action faster.
If your LMS isn’t giving you this kind of visibility yet, it might be time to expect more from your reporting.
Frequently Asked Questions
How can LMS reporting and analytics improve compliance training outcomes?
Beyond tracking completions, LMS reporting lets you monitor certification deadlines, spot overdue learners early, and automate reminders. This prevents last-minute scrambling and gives compliance managers real-time proof for audits.
Can LMS reporting help improve learner engagement, not just track it?
Yes. Reports that show drop-off points, quiz failures, and time spent per lesson help you refine content and pacing. When learners see content that’s clearer and better tailored to their needs, engagement naturally improves.
What’s the difference between LMS tracking and reporting?
Tracking refers to the raw data your LMS collects, including course starts, completions, scores, and time spent. Reporting turns that data into actionable insights through dashboards and reports. Without reporting, tracking data often stays buried or underused.
How can I align LMS reporting with organizational KPIs?
First, identify which learning metrics tie to your business goals, onboarding speed, skills growth, compliance rates, etc. Then customize reports (ProProfs Training Maker offers flexible options here) to track progress against these KPIs and present clear, relevant results to leadership.


 We'd love your feedback!
 Thanks for your feedback!


